Once your tool is running, you can monitor its performance, view execution history, and manage any issues that arise. Cargo provides comprehensive monitoring capabilities to help you understand how your tools are performing.Documentation Index
Fetch the complete documentation index at: https://docs.getcargo.ai/llms.txt
Use this file to discover all available pages before exploring further.
Records
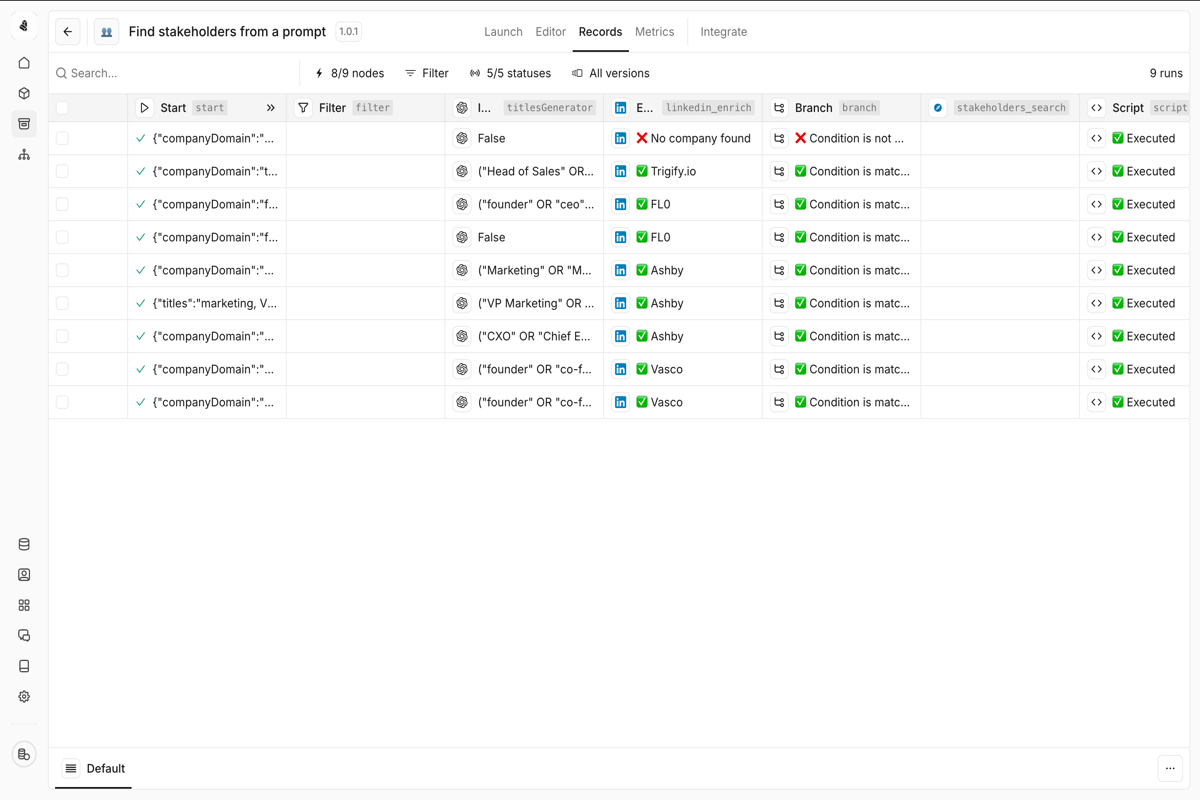
What you’ll see
| Status | Description |
|---|---|
| Running | Currently active tool executions |
| Completed | Successfully finished executions |
| Failed | Executions that encountered errors |
| Pending | Executions waiting to start |
Filtering records
Use filters to find specific executions:- By batch: View all records from a specific bulk execution
- By version: See executions from a particular tool version
- By status: Filter to running, completed, or failed executions
- By date range: Focus on a specific time period
- By node outcome: Filter based on specific node results
Inspecting an execution
Click on any record to see detailed information:- Input data: What was passed to the tool
- Node-by-node breakdown: Status and output of each step
- Timing: How long each node took to execute
- Output data: The final result returned by the tool
- Error details: For failed executions, exactly what went wrong
Retrying failed executions
When a tool execution fails, you can retry the operation:
- Navigate to the failed record in the Records view
- Click on the failed execution to view error details
- Use the Retry button to re-execute with the same inputs
- Monitor the retry attempt in the Records view
Bulk retry
For multiple failures, you can retry them in bulk:- Filter the Records view to show only failed executions
- Select multiple records using the checkboxes
- Click Retry selected to re-run all at once
Metrics
Access comprehensive performance metrics for your tool by clicking on Metrics in the tool editor.Available metrics
- Success rate: Percentage of successful vs failed executions
- Execution time: Average, p50, p95, and p99 latencies
- Volume: Number of executions over time
- Error distribution: Most common error types
- Node-level performance: Success rates and timing per node
Grouping options
View metrics grouped by:- Batches: Compare performance across bulk runs
- Versions: Track improvements or regressions between versions
- Date: Understand usage patterns over time
Troubleshooting common issues
Tool execution times out
Tool execution times out
Symptoms: Executions fail with a timeout error after running for extended periods.Solutions:
- Break complex tools into smaller, focused tools
- Check if external API calls are slow and add appropriate timeouts
- Reduce batch sizes for bulk operations
- Consider using async execution for long-running operations
Rate limit errors from integrations
Rate limit errors from integrations
Symptoms: Executions fail with 429 or rate limit errors from external services.Solutions:
- Add Delay nodes between API calls
- Use Balance nodes to distribute load
- Reduce concurrent executions in bulk runs
- Check the integration’s rate limit documentation
Data not found in enrichment
Data not found in enrichment
Symptoms: Enrich nodes return empty results when you expect data.Solutions:
- Verify the input format (e.g., domain without
https://) - Check if the company/person exists in the enrichment provider’s database
- Use multiple enrichment sources with fallback logic
- Add validation before the enrichment node
CRM write failures
CRM write failures
Symptoms: Write nodes fail when trying to update your CRM.Solutions:
- Verify the record exists (use a Read node first)
- Check field permissions in your CRM
- Ensure required fields are populated
- Validate data types match CRM field types
- Check for duplicate detection rules
Branch conditions not working as expected
Branch conditions not working as expected
Symptoms: Executions take unexpected paths through Branch or Switch nodes.Solutions:
- Check your expression syntax in the node configuration
- Verify the data type being compared (string vs number)
- Test with the exact data format from the previous node
- Use the test mode to step through the logic
Setting up alerts
Stay informed about tool issues without constantly checking the dashboard.Slack notifications
Connect Slack to receive alerts for:- Failed executions exceeding a threshold
- Success rate dropping below a percentage
- Unusual execution volumes
- Specific error types
Email alerts
Configure email notifications for critical issues:- Go to Settings → Notifications
- Add your email address
- Select which events trigger notifications
- Set frequency (immediate, hourly digest, daily digest)
Webhook alerts
Send alerts to your own systems:Best practices for monitoring
- Set up alerts early — Don’t wait for users to report issues. Configure alerts before deploying tools to production.
- Review metrics weekly — Check your tools’ metrics regularly to spot trends before they become problems.
- Track error patterns — When you see repeated failures, investigate and fix the root cause—don’t just retry.
- Version your changes — Use tool versions to correlate performance changes with code changes.